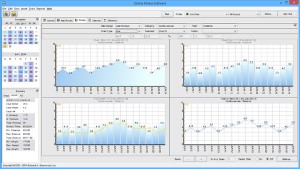
Create detailed graphs in one click. View progress on line, bar, moving average, pie and area charts. Compare workouts, weight loss, measurements, nutritional intake, sleep, temperature, weather conditions and much more. Each chart can include any date range. A powerful zoom feature makes any chart up to 10 times larger. This makes it easy to analyze data that changes very slowly, such as body weight. Display up to four charts at the same time and analyze almost anything.